As a refresher from last week’s blog post, the Praescient Intelligence Cell team has spent the last three months collecting, exploiting, and analyzing open-source information to develop actionable insights surrounding a given Area of Operation (AO). Following a rigorous Intelligence Preparation of the Battlefield (IPB) assessment, Intelligence Cell interns selected Ukraine as the AO to frame their analysis and weekly reports.
Having concluded the Spring 2022 group open-source project cycle, Team Praescient has prepared a brief overview of the tools and methods utilized by Intelligence Cell interns in analyzing and forecasting various courses of action within the ongoing Russia-Ukraine conflict. In their assessments, Praescient analysts utilized a range of structured analytic techniques (SATs) enabling them to produce meaningful findings and track situational changes week to week, on trend with global news media and open-source reporting.

PAI Primer: Triaging Real-Time Crises with OSINT Tradecraft
After completing the full six iterations of the PAI project, the strengths and weaknesses of the Diplomatic Security Index (DSI; introduced in Part 1 of this blog series) became clear. Overall, the DSI provided an indispensable window into the geopolitical basis and diplomatic rhetoric surrounding the war, and greatly enhanced analysts’ understanding of best practices when creating and formatting data.
For starters, what were the main points and analytic utility derived from the DSI? The DSI was composed of four main indicator categories: political, military, economic, and information operations. These were attributed to individual diplomatic events based on publicly available event readouts and meeting notes available from official government sources. Each of the four categories were delineated with additional sub-categories, including financial aid, sanction, pipeline, and other under the economic section.
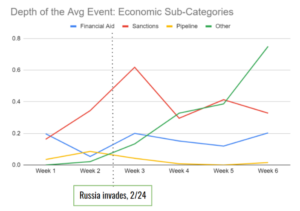
Across 583 distinct data points, the total occurrences of each attribute were summed and divided by the number of events, which allowed analysts to measure the change in category occurrence from week to week. As observed in the economic sub-category graph below, discussion of sanctions increased sharply immediately after the war began. The ‘other’ category became increasingly prevalent in the final iteration of the project, which can be attributed to more frequent talks surrounding refugee-focused humanitarian aid and global energy security–based on the data loaded into the DSI. By allowing for a visual expression of otherwise qualitative data, the DSI demonstrated its value as an analytic tool–especially in identifying discrepancies between states’ reported rhetoric and actions on the ground.

DSI Output: Cumulative Trends of Economic Indicators
In reflecting upon the full-scope of the project, the analyst’s design and application of the DSI was not without flaw. The most notable drawback to the DSI as it was constructed was that it lacked the ability to adapt to rapidly changing indicators, as the conflict progressed. From the start of the PAI cycle, the DSI was created as a means of providing diagnostic indicators for how and when states might escalate from diplomatic engagements to on-the-ground kinetic action. At the time, Russia had not yet invaded Ukraine, so research by Praescient analysts focused largely on each side’s capabilities and suspected intent within the DSI–hence why multiple attributes were created to reflect Russian force deployments and composition. Once the war began, however, this approach was no longer a predictive indicator for our analysis. Additional factors such as weapons aid, energy dependence, and refugee services grew from being virtually nonexistent into important signposts to measure the progress of the conflict.
The DSI was unfortunately not built with sufficient attributes to accommodate these emerging indicators, without retroactively restructuring the data framework, which caused the “other” markers across primary categories to balloon in size. Should incoming research analysts create a tool similar to the DSI in the future, they should ensure that any proposed indicators are adaptable to changing events and reflect the core drivers of the policy problem at hand.
An additional drawback to the DSI was the difficulty of ingesting and cleansing large amounts of unstructured data for post-production analysis–which at times limited our ability to capitalize on the full-scope of Praescient’s domain expertise in data analytics. In this case, maintaining best practices and clear consistency across all data inputs is critical. In light of the DSI’s minor shortcomings, analytic platforms, like i2 Analyst’s Notebook, can provide integral tools for discerning actionable intelligence insights from and revealing unforeseen connections between disparate data sources.
Fine-Tuning Team Praescient’s Analytical Approach
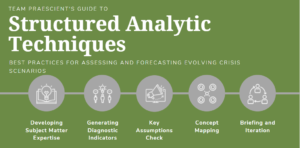
Over the course of six weeks, Praescient Research Analysts honed their OSINT investigative skills and challenged analytic assumptions via structured analytic techniques. Independent of the intelligence gap at hand, SATs provide a foundational cognitive framework for identifying and delineating key drivers of a given scenario. Week to week, the Intel Cell leveraged a range of SATs including starbursting, concept-mapping, and red teaming to challenge key assumptions and unify a coherent body of evidence, underlying the team’s analysis.
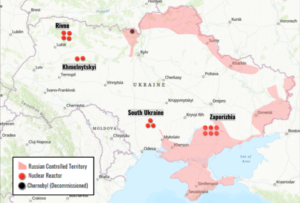
In highlighting the utility of this approach, analysts were able to identify and track several major tactical shifts as events on the battlefield unfolded. In Week 5, analysts monitored the situation in real time as Russian troops moved on and aimed to control key points of critical infrastructure across Ukraine–most notably 9 of 15 nuclear power plants, as pictured in the figure below. Having conducted an in-depth stakeholder analysis, the team forecasted that Russia was moderately likely to focus on seizing strategically important sites over winning a conventional war of attrition. In the following week, however, the Intel Cell observed a notable increase in diplomatic engagements and doctrinal action surrounding energy dependence, which led to Ukraine joining the European Energy Union. For Russia, this partnership meant that its efforts to control Ukraine’s energy supply no longer carried the same strategic consequences as intended. After observing troop movements, conflict data, and the DSI for nearly two months, the team expects the Russo-Ukrainian conflict to further fragment into low-intensity armed conflict, with heavy civilian casualties and no clear advantage on either side.

Ukrainian Nuclear Energy Sites along Russian-Controlled Territory, as of March 9th, 2022.
Key Takeaways
Through their weekly analysis and project iterations, Praescient Research Analysts learned how to identify key drivers of conflict based on known doctrinal parameters, observed battlefield outcomes, and the evolution of diagnostic indicators across the geopolitical landscape. They garnered immense analytic insight through the synthesis and analysis of unique data points across the DSI. Accounting for minor design changes, the Intelligence Cell team will continue to hone their OSINT toolkit, cognitive heuristics, and analytic skill set to approach a wider set of intelligence challenges in their upcoming individual Capstone projects.
Up Next
Be sure to stay tuned next week for insights on the power of iteration in challenging prevailing analytic assumptions. In the next installment, Intelligence Cell Research Analyst Benjamin McCrickard will provide some final lessons learned from the PAI series, focusing on how self-awareness and humility in receiving feedback are vital to effective formal briefing.