Praescient Analytics engages with a variety of internship tracks, including the Intelligence Cell, Business Development, and Chief of Staff units. This summer marked the introduction of the data science track. The addition of this track serves as a way to support professional development for interns by helping to develop technical skills and exposing them to relevant tools. Additionally, Praescient began this track to support ongoing business operations in the field of data analytics and align future professionals with real world problems. 
Defining Data Science
Data Science is a field that uses a combination of the scientific method and programming in order to gain insight on data. Some of the most common buzzwords are defined below.
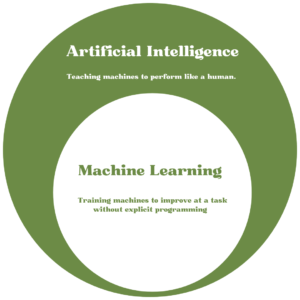
Artificial Intelligence: Artificial Intelligence (AI), involves teaching a machine to perform a given task on its own. More specifically, it involves teaching a machine to think like a human.
Machine Learning: Machine Learning (ML) is an application of AI where the machine is trained to get better at a given task without any explicit programming.
Data Mining: This involves extracting and finding patterns in data sets by using methods involving machine learning and statistics.
Big Data: Big data simply refers to larger, more complex data sets that are difficult to deal with using traditional data-processing software.
While data science is a relatively new field, it is growing in demand. It has a wide range of applications, such as fraud detection, customer service, predictive maintenance, natural language processing, and cybersecurity. At Praescient, data science is used in the form of open-source tools that deal with pattern recognition, natural language processing, and entity extraction/linking.
An Exploration of Projects + Key Takeaways From an Intern
“So far this summer, I’ve been exposed to a variety of new tools under the guidance of Senior Systems Engineer, Robert Wessinger.
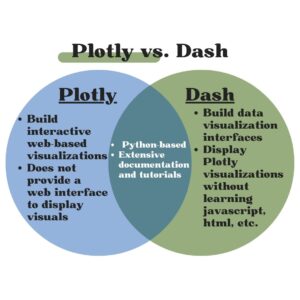
One of the projects involved using a combination of Pandas and Plotly in order to analyze movement data. Pandas is a Python library that provides data structures for relational/labeled data. The supported data structures are known as Series and Data frames. Plotly is another Python library that can be used to create visualizations for your data. I utilized Pandas to create and edit data frames storing the labeled data. After that, Plotly allowed for visualization creation displaying the most relevant information.
Another project involved Pandas and Dash. Dash is a Python framework (made by Plotly) that can be used to create interactive web apps. This can be in the form of dropdowns, text input, checkboxes, and more. Pandas allowed me to create a data frame based on API data. Dash then helped me incorporate the filtering and isolation of data entries of interest. As an intern, I also participated in sprint cycles, which showed me the effect of good sprint planning on the quality of deliverables.”

The Power of Combining Data Science and Data Analytics
There are many benefits to combining data science with data analytics. With cleaner data, you can focus on the most relevant and up-to-date information for analysis. It can also catch potentially overlooked patterns and combinations of attributes. Overall, data science and data analytics can be quite the powerful combination. At Praescient, our team strives to close the gap between the analyst and the data scientist. Our team finds that more powerful, targeted, and effective analytic findings come from a dynamic group that understands all aspects of the intelligence cycle. When the data scientist starts thinking a little like the analyst, and the analyst does the same, this is when challenges can be overcome more effectively and in all directions.