Tableau is a business intelligence tool that works in assisting people to explore and manage data. It has many uses but primarily focuses on making businesses more data-driven by allowing for data to be visualized. Within the intelligence community, Tableau has similar analytics capabilities to i2 Analyst’s Notebook and Esri, in some aspects, but the platform as a whole is interactive when it comes to explaining how the data that is being analyzed is connected.
The platform, as a whole, is adaptable according to the business needs through the platform’s capabilities. An example of this includes tracking sales by month in each region or following fraud activity within a financial company. At Praescient Analytics, we have a demo showing how Tableau can be used to track and analyze fraud within the CARES Act and Paycheck Protection Program loans. Tableau was used in conjunction with IBM i2 Enterprise Insight Analysis (EIA) to complete this analysis, showing how these software’s can be used together to accurately map intelligence collection and activity.
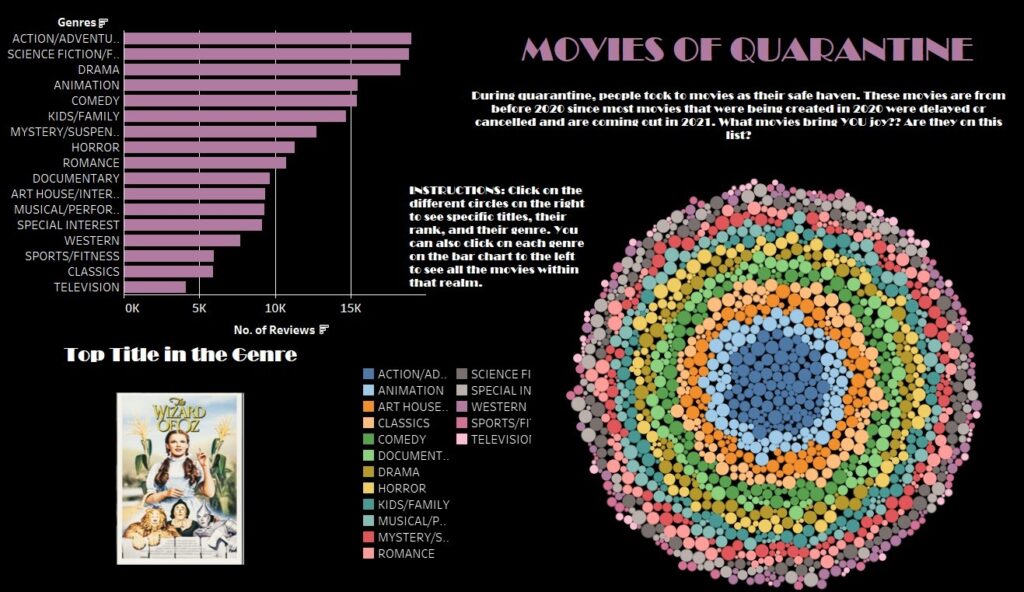
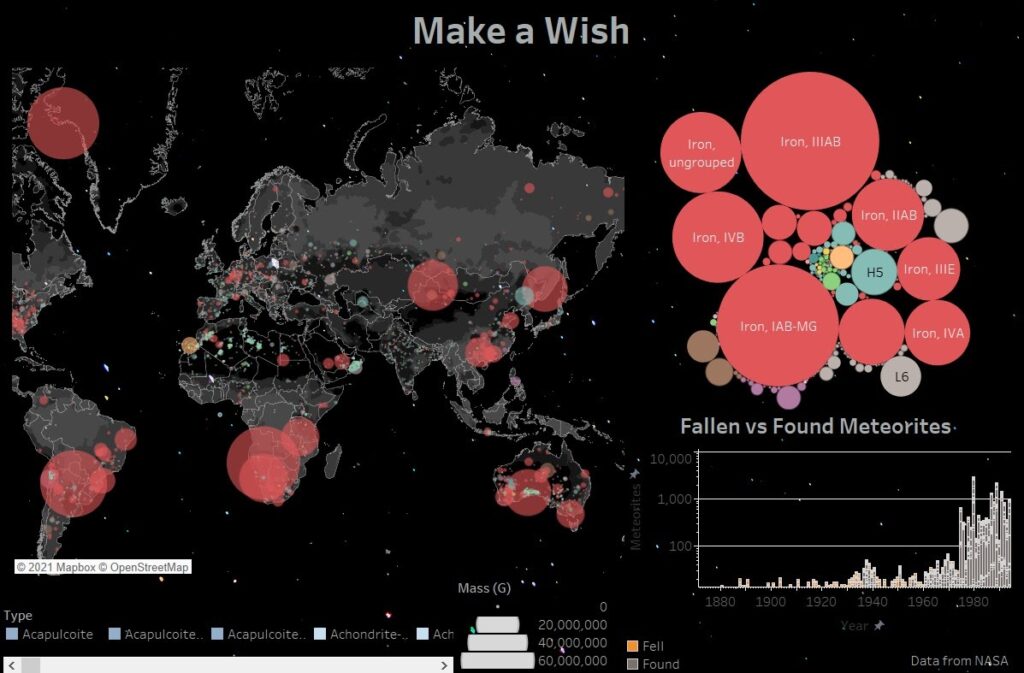
Recently, Praescient’s Intelligence Cell team has learned how to analyze and visualize data in Tableau and submitted two Tableau visuals to a competition. Each year, Tableau hosts a competition called Iron Viz where people all over the world are able to create an interactive workbook to show Tableau’s capabilities. For 2021, the theme was “Data + Joy” which asked participants to show topics they love, find data sets, then lay it out within a Tableau dashboard. The Intelligence Cell is split into two teams: Team Alpha and Team Bravo. Team Alpha’s choice of topic was “Movies of Quarantine,” with Team Bravo’s choice being “Shooting Stars.”
Each team began by finding publicly available data sets that encompassed the idea they were wanting to visualize. Once they found sets that fit, they moved to upload, analyze, and format how their data could be shown through interactive visualization. As seen below, the visualizations are colorful and fun to work with and create a narrative using the data.
Team Alpha

Team Bravo

Tableau is an emerging interactive tool to present and show analysis within the Intelligence Community. In the future, using Tableau in conjunction with other sourcing and analysis tools will prove to be a more effective flow when looking into tracking activities.