We are pleased to announce a joint effort between Praescient and SynGlyphX showcasing the combined capabilities of our analysts and their interactive, 3D data visualization technology. The SynGlyphX visualization platform allows users to integrate extremely large, diverse sources of information and represent them in a way that is visually intuitive and easily understandable. Our organizations have worked together to release a video demo illustrating a use case in which we track suspect vessels in fleet of Islamic Republic of Iran Shipping Lines (IRISL).
We examined data occurring over a five year period, starting in 2008 and ending in 2012. During that time, the United States had imposed strict sanctions on Iran’s principal international shipping organization due to its involvement in weapons trafficking. To circumvent these sanctions, IRISL developed a complex corporate shell structure around its ships to mask its shipping activities. Despite the best efforts of the U.S. Department of Treasury Office of Foreign Assets Control (OFAC), Iran has stayed one step ahead of the blacklist, spreading confusion throughout the public and private sectors in the US and abroad.
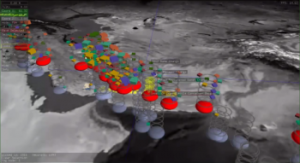
In order to explore the massive quantity of data associated with these shipping records, our analyst used SynGlyphX technology to create both still and animated visualizations for IRISL ships and their characteristics over time. With this custom visual nomenclature, suspicious activity (in the form too-frequent changing flags and designations) becomes readily apparent. Further demonstrating the platform’s powerful capabilities, our analyst placed the newly represented vessels in a geospatial and temporal context.

The SynGlyphX platform illustrating changes to IRISL vessel designations over time and across the Middle East and Asia
This same data can be broken down in a totally different (e.g., non-geospatial) way using a three-dimensional grid. An analyst can easily observe from this new visualization the types of ships most likely to be trafficking weapons by tracking the frequency of changes to their designations. SynGlyphX’s navigation features allow easy exploration of the 3D environment, allowing the user to quickly gain actionable insight. The ability to directly link objects to original information sources provide traceability to the underlying provenance of data and rounds out the platform’s capabilities, allowing the analyst to dive deep into any one aspect of the visualization.
Check out the video below for a full overview of the IRISL demo. Be sure to visit the SynGlyphX homepage to see other examples of their powerful data visualization technology.