In this week’s blog, Research Analyst Rhys Hartsough, details her cryptocurrency capstone that develops a workflow to “follow the money” and identify an illegal network of money-laundering within Bitcoin transaction data.
2021 was a huge year for cryptocurrency. But what should we expect in 2022?
We’ve watched as Bitcoin hit numerous all-time high prices over the past year, followed by colossal dips, and then an increased corporate buy-in from notable companies. The Biden administration has even progressively announced interest in new regulations for cryptocurrency. Meanwhile, society’s intrigue in cryptocurrency has escalated. It’s now the trendy motif not only among investors but in popular culture as well. Thanks to everyone from long-standing financers like Elon Musk to that kid from your high school on Facebook.
In Hartsough’s previous blog, she touched on how cryptocurrency had seeped its way into the human trafficking industry and how investigative analysts are using the very concealment tools the criminals exploited in order to unmask them. In this installment, she will transform her words into actions by constructing a workflow that narrates how open-source analysts can manually “follow the money” with the help of i2 Analyst’s Notebook.
What’s the Big Deal?
The acceleration in popularity of blockchain technology has exponentially facilitated the spread of cybercrime. Tougher AML protocol efforts that have been slowly implemented in the last year, have prompted threat actors to pursue workarounds to transfer funds between associates either through novel means or by re-calibrating existing cash-out methods, usually in cryptocurrency. This technological disruption is not going away anytime soon, therefore, knowing how to navigate and detect cryptocurrency misconduct should be at the forefront of our society’s future cybersecurity literacy. One of the most prevalent and effortless transgressions perpetrators are employing is digital money laundering. Money laundering involves turning illegally procured (dirty) money into legitimate (clean) money, the basic process is the same in digital currency as it is with tangible cash. Accurately understanding how to discover and thus halt crypto laundering can thwart the assets from advancing on to fund numerous illegal networks (drug trafficking, human trafficking, etc).

Learning the Lingo
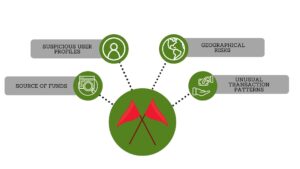
In order to effectively design a manual workflow for the identification of an illicit network, it is important to understand what an analyst would normally look for when conducting an investigation of cryptocurrency transactions. Cryptocurrencies represent an attractive option to money launderers because of the anonymity they provide and the speed with which they can be transferred between users. In fact, a huge amount of cryptocurrency-based money laundering flows through exchange platforms, like Coinbase. These exchanges act as intermediaries between the buyer and seller, allowing users to trade assets. This trading technique is effective at blurring the money trail, making it more difficult for investigators to follow the chain of transactions. In order to combat this technique, law enforcement has determined “red flags” within a network of transactions that indicates illicit activity occurring. The first structuring trend Hartsough decided to implement into her demonstration was the flow of multiple small amounts, under record keeping thresholds, that were being transferred immediately into multiple virtual asset service providers (VASPs). The second prominent trend assembled was a routine pattern of multiple, high-value transactions within a 24 hour period with no further activity within the wallet address after the fact. These two trends are significant indicators of laundered cryptocurrency therefore, by incorporating them within the datasets, analysts are able to simulate an illegal web of transactions that are traceable.
Introducing…the Data Model
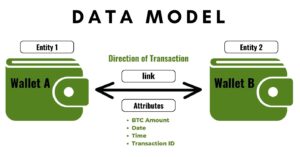
Arguably one of the most important steps to begin a network analysis is assembling a holistic data model. Data modeling allows us to map out our future analysis structure and construct a visual representation of the connections between data points. The first step in data modeling is to decide on the columns of the dataset that will turn into the entities and attributes. Next, the links and their multiplicity are determined. For this money-laundering structure, two separate wallets are connected to demonstrate a transaction exchanged between the addresses. The date, time, and amount of the transaction (BTC) were added as attributes to the link in order to give context to the activity.
Designing the Narrative
To create the illicit network showing active money-laundering, 21 wallets were identified and then connected within the dataset by using the two trends previously mentioned. The “dealer” is the head honcho of the organization, and will be referred to as “Wallet A”. Wallet A employs a system of associates who create 20 various wallet addresses in order to complicate the trail of transactions that eventually lead to a single cryptocurrency exchange address. Wallet A begins by transferring .24 BTC to 20 different addresses, which is under the reporting threshold, and is therefore overlooked in initial sweeps for illicit activity. The 20 associates then begin assorted transfers within their organization of diverse amounts of BTC to jumble up the line of commerce. The 20 associates eventually send the total BTC originally transferred to a select 5 addresses within said network, which will become the last transfer of the “dirty money”. Those 5 wallets then transfer .97 BTC to the same exchange address, effectively “cleaning” almost 5 BTC, or roughly $200,000.
Initial Insights
The narrative and the data model set the stage for the main event: link analysis. Once Hartsough configured the data to represent the correct web of transactions, she imported it into i2 Analyst’s Notebook to begin the initial analysis. Praescient recognizes the various capabilities within i2 Analyst’s Notebook for this specific use case and showcases this through multiple interconnected vignettes. The first vignette used with this data starts with a flagged wallet address that was sent to an analyst for investigation, with the request to follow the flow of the transactions for that account. Building observations through the provided analysis tools is very simple with i2 and an initial look into the tailored data yields plentiful findings. A trend of transactions sent after 5pm on the first few days of each month was analyzed through the use of the bar charts and histograms tab. Additionally, the Find Cluster function detailed a web of most connected entities linked to the initial flagged account. Finally, a workflow led through an intricate pathway, was created to trace all the way back to the original wallet A that instigated the initial illegal transaction.
Keep on the look out for a future Praescient demo visually walking through each step of the above investigation and more, with the help of i2 Analyst’s Notebook!